- An Introduction to Machine Learning | The Complete Guide
- Data Preprocessing for Machine Learning | Apply All the Steps in Python
- Regression
- Learn Simple Linear Regression in the Hard Way(with Python Code)
- Multiple Linear Regression in Python (The Ultimate Guide)
- Polynomial Regression in Two Minutes (with Python Code)
- Support Vector Regression Made Easy(with Python Code)
- Decision Tree Regression Made Easy (with Python Code)
- Random Forest Regression in 4 Steps(with Python Code)
- 4 Best Metrics for Evaluating Regression Model Performance
- Classification
- A Beginners Guide to Logistic Regression(with Example Python Code)
- K-Nearest Neighbor in 4 Steps(Code with Python & R)
- Support Vector Machine(SVM) Made Easy with Python
- Kernel SVM for Dummies(with Python Code)
- Naive Bayes Classification Just in 3 Steps(with Python Code)
- Decision Tree Classification for Dummies(with Python Code)
- Random forest Classification
- Evaluating Classification Model performance
- A Simple Explanation of K-means Clustering in Python
- Hierarchical Clustering
- Association Rule Learning | Apriori
- Eclat Intuition
- Reinforcement Learning in Machine Learning
- Upper Confidence Bound (UCB) Algorithm: Solving the Multi-Armed Bandit Problem
- Thompson Sampling Intuition
- Artificial Neural Networks
- Natural Language Processing
- Deep Learning
- Principal Component Analysis
- Linear Discriminant Analysis (LDA)
- Kernel PCA
- Model Selection & Boosting
- K-fold Cross Validation in Python | Master this State of the Art Model Evaluation Technique
- XGBoost
- Convolution Neural Network
- Dimensionality Reduction
Random forest Classification | Machine Learning
Random Forest is an ensemble learning technique. It builds a number of decision trees on the randomly selected data sample. Then it gets predictions from each tree and by means of majority voting, it selects the decision which gets the majority vote.
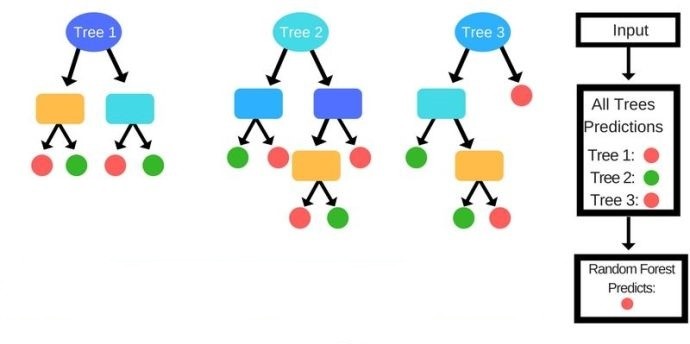
How does the Algorithm work?
As said earlier, this algorithm is based on decision trees. For a given dataset, it takes some random data points, builds decision trees one at a time around them. The number of trees is defined in the program. Then it comprises the predictions of all the decision trees. From the predictions, it chooses the best one which is predicted by the most number of trees.
The steps for Random Forest Algorithms are as follows-
STEP 1: Pick at random K data points from the Training set.
STEP 2: Build the Decision Tree associated with these K data points.
STEP 3: Choose the number Ntree of trees you want to build and repeat STEPS 1 & 2
STEP 4: For a new data point, make each one of your Ntree trees predict the category to which the data points belongs, and assign the new data point to the category that wins the majority vote.
This simple ensemble technique gives astonishingly accurate predictions. This is because one decision tree may provide wrong predictions, but aggregating the decisions of a large number of trees will reduce the wrong predictions leading to more accurate predictions.
Now, we will implement this algorithm in Python.
Random Forest Classification in Python:
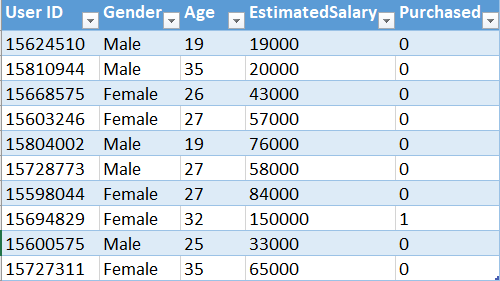
For this task, we will use the dataset named Social_Network_Ads.csv. This dataset contains the age, salary, and buying choice for a specific product of a number of customers through social network ads. Our task is to classify what will be the buying choice of a future customer upon given these features. Let's have a glimpse of that dataset
 .
.
You can download the whole dataset from here.
First of all, we will import the essential libraries to our program. You will get the code in Google Colab also.
# Importing the libraries import numpy as np import matplotlib.pyplot as plt import pandas as pd
Then we will import the dataset into our program and divide the attributes into Feature matrix and dependent variable vectors. Here the Age and EstimatedSalary are the independent attributes, so we will put them into the Feature matrix and the Purchased column into the dependent variable vector.
# Importing the dataset dataset = pd.read_csv('Social_Network_Ads.csv') X = dataset.iloc[:, [2, 3]].values y = dataset.iloc[:, 4].values Now, we will split the dataset into training and test sets. # Splitting the dataset into the Training set and Test set from sklearn.model_selection import train_test_split X_train, X_test, y_train, y_test = train_test_split(X, y, test_size = 0.25, random_state = 0)
We need to scale our dataset for a more accurate prediction.
# Feature Scaling from sklearn.preprocessing import StandardScaler sc = StandardScaler() X_train = sc.fit_transform(X_train) X_test = sc.transform(X_test)
It's time to fit the Random Forest algorithm to our dataset.
# Fitting Random Forest Classification to the Training set from sklearn.ensemble import RandomForestClassifier classifier = RandomForestClassifier(n_estimators = 10, criterion = 'entropy', random_state = 0) classifier.fit(X_train, y_train)
Note: Here n_estimators defines the number of decision trees we want in our Random Forest.
We have built our model. Now, Lets see how it predicts on the test set.
# Predicting the Test set results y_pred = classifier.predict(X_test)
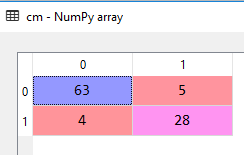
We could build the confusion matrix to see the accuracy of our model.
# Making the Confusion Matrix from sklearn.metrics import confusion_matrix cm = confusion_matrix(y_test, y_pred)
We have come to the most exciting and fun part. Lets visualize the predictions of our model for training and test sets.
# Visualising the Training set results from matplotlib.colors import ListedColormap X_set, y_set = X_train, y_train X1, X2 = np.meshgrid(np.arange(start = X_set[:, 0].min() - 1, stop = X_set[:, 0].max() + 1, step = 0.01), np.arange(start = X_set[:, 1].min() - 1, stop = X_set[:, 1].max() + 1, step = 0.01)) plt.contourf(X1, X2, classifier.predict(np.array([X1.ravel(), X2.ravel()]).T).reshape(X1.shape), alpha = 0.75, cmap = ListedColormap(('red', 'green'))) plt.xlim(X1.min(), X1.max()) plt.ylim(X2.min(), X2.max()) for i, j in enumerate(np.unique(y_set)): plt.scatter(X_set[y_set == j, 0], X_set[y_set == j, 1], c = ListedColormap(('red', 'green'))(i), label = j) plt.title('Random Forest Classification (Training set)') plt.xlabel('Age') plt.ylabel('Estimated Salary') plt.legend() plt.show() 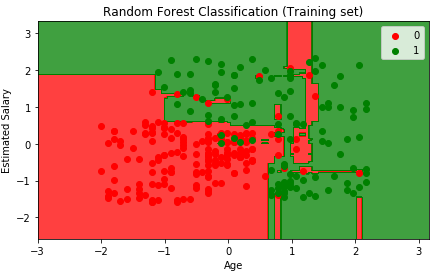
# Visualising the Test set results from matplotlib.colors import ListedColormap X_set, y_set = X_test, y_test X1, X2 = np.meshgrid(np.arange(start = X_set[:, 0].min() - 1, stop = X_set[:, 0].max() + 1, step = 0.01), np.arange(start = X_set[:, 1].min() - 1, stop = X_set[:, 1].max() + 1, step = 0.01)) plt.contourf(X1, X2, classifier.predict(np.array([X1.ravel(), X2.ravel()]).T).reshape(X1.shape), alpha = 0.75, cmap = ListedColormap(('red', 'green'))) plt.xlim(X1.min(), X1.max()) plt.ylim(X2.min(), X2.max()) for i, j in enumerate(np.unique(y_set)): plt.scatter(X_set[y_set == j, 0], X_set[y_set == j, 1], c = ListedColormap(('red', 'green'))(i), label = j) plt.title('Random Forest Classification (Test set)') plt.xlabel('Age') plt.ylabel('Estimated Salary') plt.legend() plt.show() 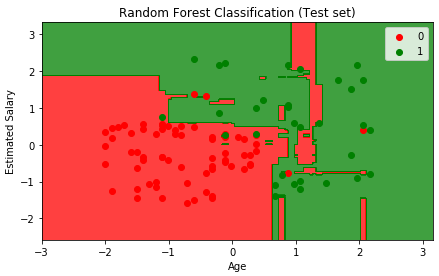
If you compare the results with a single Decision Tree classifier, you must find that Random Forest tends to provide more accurate predictions.