- An Introduction to Machine Learning | The Complete Guide
- Data Preprocessing for Machine Learning | Apply All the Steps in Python
- Regression
- Learn Simple Linear Regression in the Hard Way(with Python Code)
- Multiple Linear Regression in Python (The Ultimate Guide)
- Polynomial Regression in Two Minutes (with Python Code)
- Support Vector Regression Made Easy(with Python Code)
- Decision Tree Regression Made Easy (with Python Code)
- Random Forest Regression in 4 Steps(with Python Code)
- 4 Best Metrics for Evaluating Regression Model Performance
- Classification
- A Beginners Guide to Logistic Regression(with Example Python Code)
- K-Nearest Neighbor in 4 Steps(Code with Python & R)
- Support Vector Machine(SVM) Made Easy with Python
- Kernel SVM for Dummies(with Python Code)
- Naive Bayes Classification Just in 3 Steps(with Python Code)
- Decision Tree Classification for Dummies(with Python Code)
- Random forest Classification
- Evaluating Classification Model performance
- A Simple Explanation of K-means Clustering in Python
- Hierarchical Clustering
- Association Rule Learning | Apriori
- Eclat Intuition
- Reinforcement Learning in Machine Learning
- Upper Confidence Bound (UCB) Algorithm: Solving the Multi-Armed Bandit Problem
- Thompson Sampling Intuition
- Artificial Neural Networks
- Natural Language Processing
- Deep Learning
- Principal Component Analysis
- Linear Discriminant Analysis (LDA)
- Kernel PCA
- Model Selection & Boosting
- K-fold Cross Validation in Python | Master this State of the Art Model Evaluation Technique
- XGBoost
- Convolution Neural Network
- Dimensionality Reduction
4 Best Metrics for Evaluating Regression Model Performance | Machine Learning

The performance of a regression model can be understood by knowing the error rate of the predictions made by the model. You can also measure the performance by knowing how well your regression line fit the dataset.
In this post, we will try to understand how to measure the performance of regression models.
A good regression model is one where the difference between the actual or observed values and predicted values for the selected model is small and unbiased for train, validation and test data sets.
To measure the performance of your regression model, some statistical metrics are used. Here we will discuss four of the most popular metrics. They are-
Mean Absolute Error(MAE)
Root Mean Square Error(RMSE)
Coefficient of determination or R2
Adjusted R2
Mean Absolute Error(MAE)
This is the simplest of all the metrics. It is measured by taking the average of the absolute difference between actual values and the predictions.
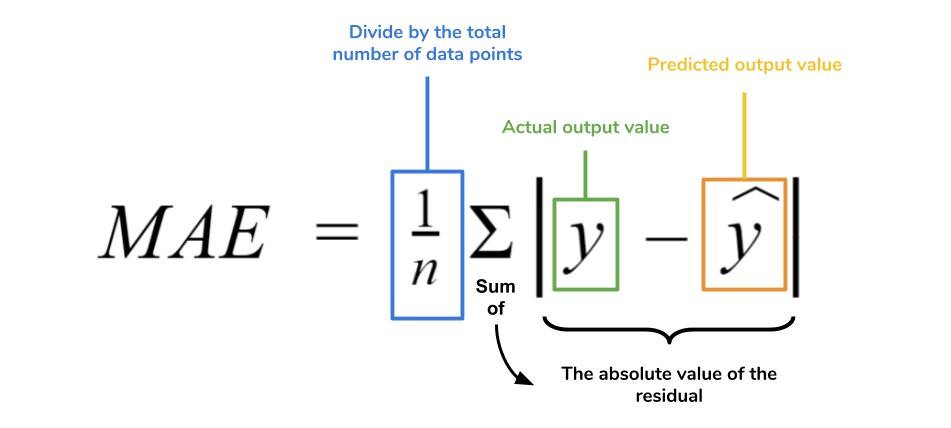
Suppose we have a model that predicted the salary of 4 employees which are $988, $1943, $1239, $2124 where the actual salaries were $1000, $1500, $2000. $2500 respectively.
If we take the absolute difference of the predictions and the actual values we get:
| 1000 - 988 | = 12 | 1500 - 1943 | = 443 | 2000 - 1239 | = 761 | 2500 - 2124 | = 376
Now, MAE = (12 + 443 + 761 + 376) / 4 = 398
What does this MAE value mean? This value tells us that the model is predicting $398 more or less on average than the actual value.
Note: The less the value of MAE the better the performance of your model.
Root Mean Square Error(RMSE)
The Root Mean Square Error is measured by taking the square root of the average of the squared difference between the prediction and the actual value. It represents the sample standard deviation of the differences between predicted values and observed values(also called residuals). It is calculated using the following formula:
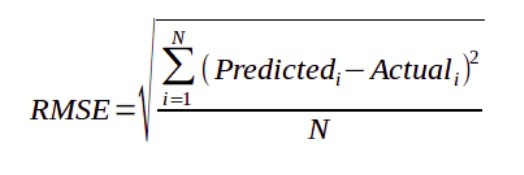
If we take our previous example again, then we have-
RMSE = sqrt((122 + 4432 + 7612 + 3762) / 4) ~478 *sqrt = Sqare Root
Here the RMSE value is greater than that of MAE. This is because RMSE takes the square of the differences between the predictions and the actual value, hence the value is greater the MAE value.
Both MAE and RMSE are in the same units as the dependent variable. As compared to MAE, RMSE will give higher weight to the errors and punish large errors in the model. RMSE is the default metric of many models as the loss function defined in terms of RMSE is smoothly differentiable and makes it easier to perform mathematical operations.
RMSE is a better performance metric as it squares the errors before taking the averages. For that, large errors receive higher punishment. It performs particularly well when large errors are undesirable for your model's performance.
Note: When you have more samples then reconstructing the error distribution using RMSE is more reliable. But RMSE is highly sensitive to outlier values(an outlier is a data point that differs significantly from other observations). Hence, prior to using this metric, you must remove the outliers from your data set.
Coefficient of Determination or R^2
It measures how well the actual outcomes are replicated by the regression line. It helps you to understand how well the independent variable adjusted with the variance in your model. That means how good is your model for a dataset. The mathematical representation for R^2 is-
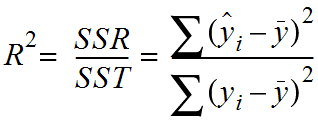
Here, SSR = Sum Square of Residuals(the squared difference between the predicted and the average value)
SST = Sum Square of Total(the squared difference between the actual and average value)
The above equation can be easily understood by the following illustration:
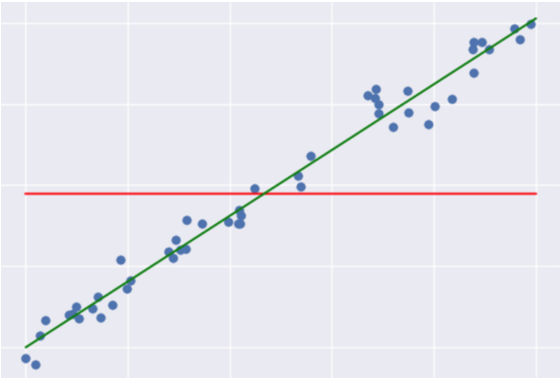
Here the green line represents the regression line and the red line represents the average line. The differences in data points from these lines are taken in the equation.
Usually, the value of R^2 lies between 0 to 1(it can be negative if the regression line somehow has a worse fit than the average!). The closer its value to one, the better your model is. This is because either your regression line has well fitted the dataset or the data points are distributed with low variance. Which lessens the value of the Sum of Residuals. Hence, the equation gets closer to one.
Adjusted R-squared
There is a drawback of R^2 that it improves every time when we add new variables in the model.
Think about it, whenever you add a new variable there can be two circumstances, either the new variable improves your model or not. When the new variable improves your model then it is ok. But what if it does not improve your model? Then the problem occurs. The value of R^2 keeps on increasing with the addition of more independent variables even though they may not have a significant impact on the prediction.
To solve this pitfall, an Adjusted R^2 value is used instead of R^2 value. The mathematical representation for Adjusted R^2 is-
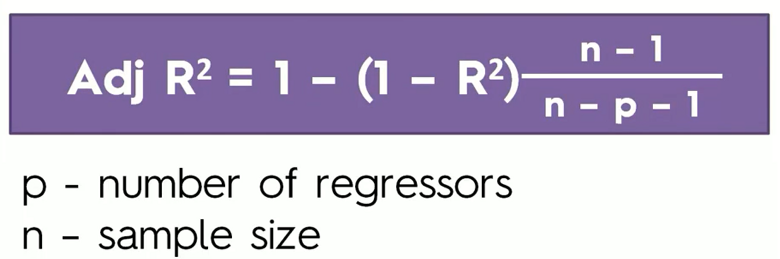
Adjusted R^2 will penalize the model whenever you add a new variable to it. From the equation, you can understand that clearly. Whenever you add a new variable, the value of R^2 increases and it also increases the denominator( n - p - 1 ) on the left of the equation. As the denominator increases, it increases the value of 1 - R^2 on the left of the equation. Which in turn decreases the value of Adjusted R^2. Hence, using an Adjusted R^2 value you can better understand the effect of the additional variables to your model.
Note: Adjusted R^2 is greatly helpful when your dataset contains more features and you need to choose the most effective features to train your model.
Which Regression Model is the Best?
Well, this is subjective to your dataset and the model you choose. Each machine learning model solves a problem with a different objective using a different dataset. Hence, you must understand the context of using that model before choosing a metric.