- An Introduction to Machine Learning | The Complete Guide
- Data Preprocessing for Machine Learning | Apply All the Steps in Python
- Regression
- Learn Simple Linear Regression in the Hard Way(with Python Code)
- Multiple Linear Regression in Python (The Ultimate Guide)
- Polynomial Regression in Two Minutes (with Python Code)
- Support Vector Regression Made Easy(with Python Code)
- Decision Tree Regression Made Easy (with Python Code)
- Random Forest Regression in 4 Steps(with Python Code)
- 4 Best Metrics for Evaluating Regression Model Performance
- Classification
- A Beginners Guide to Logistic Regression(with Example Python Code)
- K-Nearest Neighbor in 4 Steps(Code with Python & R)
- Support Vector Machine(SVM) Made Easy with Python
- Kernel SVM for Dummies(with Python Code)
- Naive Bayes Classification Just in 3 Steps(with Python Code)
- Decision Tree Classification for Dummies(with Python Code)
- Random forest Classification
- Evaluating Classification Model performance
- A Simple Explanation of K-means Clustering in Python
- Hierarchical Clustering
- Association Rule Learning | Apriori
- Eclat Intuition
- Reinforcement Learning in Machine Learning
- Upper Confidence Bound (UCB) Algorithm: Solving the Multi-Armed Bandit Problem
- Thompson Sampling Intuition
- Artificial Neural Networks
- Natural Language Processing
- Deep Learning
- Principal Component Analysis
- Linear Discriminant Analysis (LDA)
- Kernel PCA
- Model Selection & Boosting
- K-fold Cross Validation in Python | Master this State of the Art Model Evaluation Technique
- XGBoost
- Convolution Neural Network
- Dimensionality Reduction
Decision Tree Regression Made Easy (with Python Code) | Machine Learning

In this tutorial, we are going to understand the decision tree regression and implement it in Python
What is a Decision Tree?
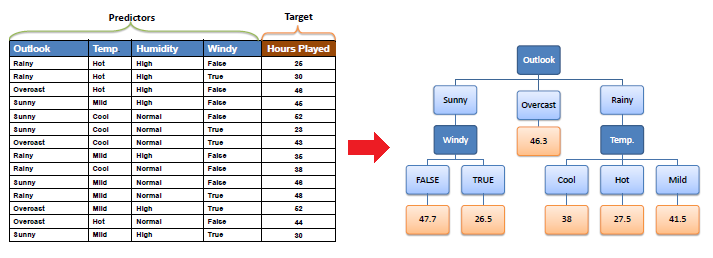
This Regression is based on the decision tree structure. A decision tree is a form of a tree or hierarchical structure that breaks down a dataset into smaller and smaller subsets. At the same time, an associated decision tree is incrementally developed. The tree contains decision nodes and leaf nodes. The decision nodes(e.g. Outlook) are those nodes that represent the value of the input variable(x). It has two or more than two branches(e.g. Sunny, Overcast, Rainy). The leaf nodes(e.g. Hours Played) contain the decision or the output variable(y). The decision node that corresponds to the best predictor becomes the topmost node and called the root node.
Decision Trees are used for both Classification and Regression tasks. In this tutorial, we will focus on Regression trees.
Let's consider a scatter plot of a certain dataset.
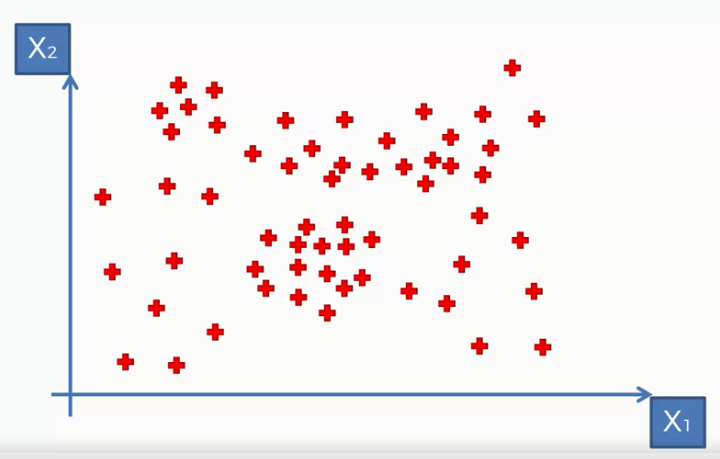
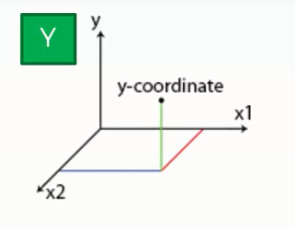
Here, we take a dataset that contains two independent variables X1, and X2 and we are predicting a third dependent variable y. You can not find it on the scatterplot as it has two dimensions. To visualize y, we need to add another dimension and after that, it would like the following:
How Does a Decision Tree Work for Regression?
Well, for this our decision tree would make some splits on the dataset based on information entropy( information entropy tells how much information there is in an event). This is basically dividing the points into some groups. The algorithm decides the optimal number of splits and splits the dataset accordingly. The figure will make it clear
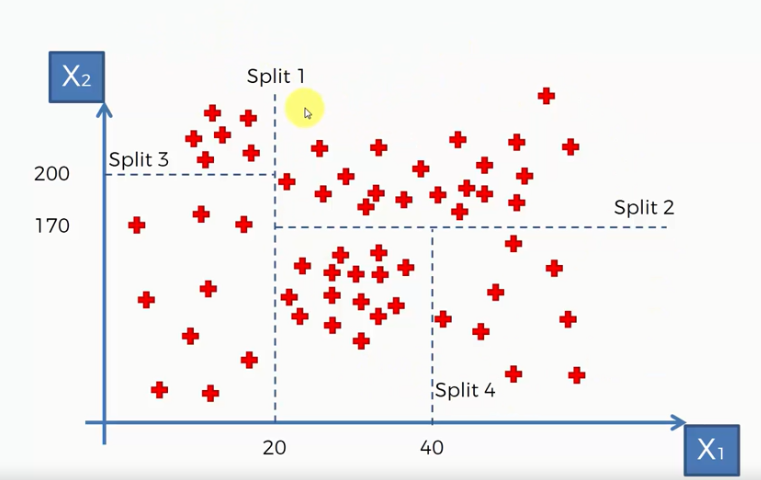
Here we can see the decision tree made four splits and divided the data points into five groups.
Now, this algorithm will take the average value of each group and based on that values it will build the decision tree for this dataset. The tree would look like the following:
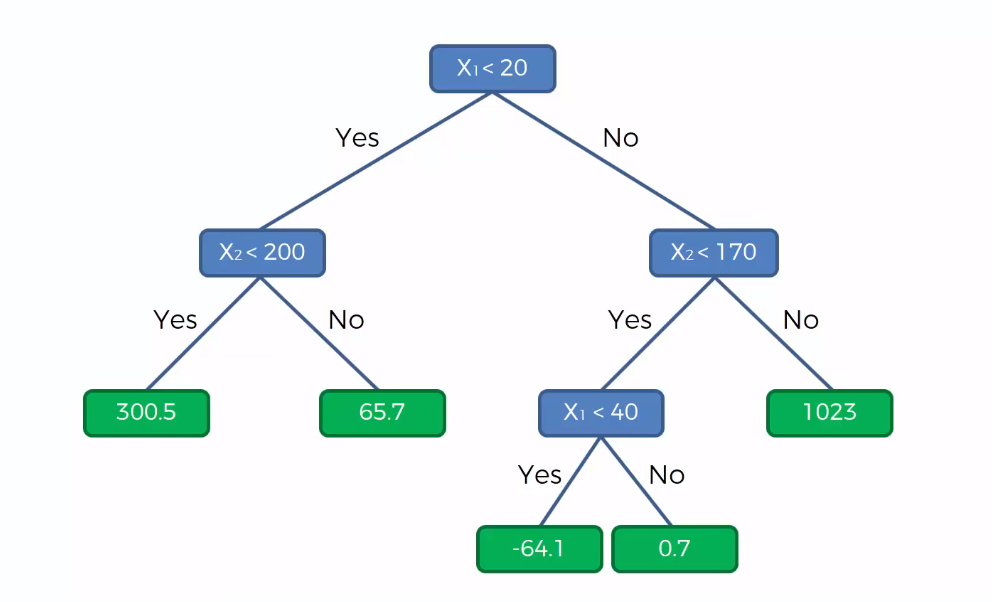
The decision tree above shows that whenever a value of y falls in one of the leaves, it will return the value of that leaf as the prediction for that y value.
Implementing Decision Tree Regression in Python
Let's implement the above idea in Python. We will work on a dataset (Position_Salaries.csv) that contains the salaries of some employees according to their Position. Our task is to predict the salary of an employee according to an unknown level. So we will make a Regression model using Decision Tree for this task.
You can download the dataset from here.
First of all, we will import the essential libraries. You will get the full code in Google Code.
# Importing the Essential Libraries
import numpy as np import pandas as pd
import matplotlib.pyplot as plt
Then, we import our dataset.
# Importing the Dataset
dataset = pd.read_csv("Position_Salaries.csv")
After executing this code, the dataset will be imported into our program. Let's have a look at that dataset:
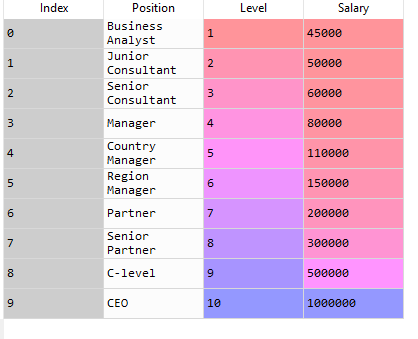
Now, we need to determine the dependent and independent variables. Here we can see the Level is an independent variable while Salary is the dependent variable or target variable as we want to find out the salary of an employee according to his Level. So our feature matrix X will contain the Level column and the value of Salary is taken into the dependent variable vector, y.
# Creating Feature Matrix and Dependent Variable Vector
X = dataset.iloc[:, 1:2].values y = dataset.iloc[:, 2].values
Now, we use DecisionTreeRegressor class from the Scikit-learn library and make an object of this class. Then we will fit the object to our dataset to make our model.
# Fitting Decision Tree Regression to the dataset
from sklearn.tree import DecisionTreeRegressor regressor = DecisionTreeRegressor(random_state = 0)
regressor.fit(X, y)
Well, our model is ready! Let's test our model to know how it predicts an unknown value.
# Predicting a new result
y_pred = regressor.predict([[6.5]])
We predict the result of 6.5 level salary. After executing the code, we get an output of $150k. To learn how closely our model predicted the value,
Visualizing Decision Tree Regression in Python
lets visualize the training set.
# Visulizing the Training Set
X_grid = np.arange(min(X), max(X), 0.01)
X_grid = X_grid.reshape((len(X_grid), 1))
plt.scatter(X, y, color = 'red') plt.plot(X_grid, regressor.predict(X_grid), color = 'blue')
plt.title('Decision Tree Regression')
plt.xlabel('Position level')
plt.ylabel('Salary') plt.show()
The plot would look like this:
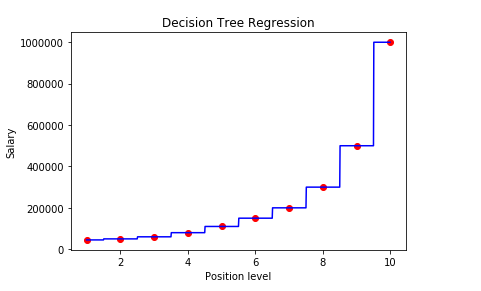
After executing the code, we can see a graph, where we plotting a prediction of 10 salaries corresponding to 10 levels. It is a nonlinear and non-continuous regression model. This graph does not look like the other linear regression models. Because the decision tree regression takes the average value of each group and assigns this value for any variable that falls in that group. So the graph is not continuous rather it looks like a staircase.
From the graph, we see that the prediction for a 6.5 level is pretty close to the actual value(around $160k). So we can say it is a good regression model.
Advantages and Disadvantages of Decision Tree Regression
Decision tree for regression comes with some advantages and disadvantages, let's have a look at them-
Advantages
- Less Data Preprocessing Unlike other machine learning algorithms, a decision tree does not require well-preprocessed data.
- No Normalization Decision tree does not require normalized data
- No Scaling You need not scale the data before feeding it to the decision tree model
- Not Affected by Missing Value Unlike K nearest Neighbor or other distance-based algorithms, a decision tree is not affected by missing values
- Easy and Intuitive A decision tree is intuitive and fairly easy to understand and explain the underlying properties
Disadvantages
- Highly Sensitive A small change in data can cause high instability to a decision tree model
- Complex Calculation A decision tree uses more complex computation compared to other models
- High Training Time It takes higher time to train a decision tree model
- Costly Decision tree-based models require more space and time, so it is computationally expensive to use
- Weak A single tree can not learn much of the data, therefore, you won't get a good predictor using a single decision tree. You need to ensemble a higher number of decision trees e.g. random forest to get better prediction accuracy
Decision Tree Regression FAQs
Here I answered some of the frequently asked questions about decision tree regression
What is Entropy in a Decision Tree?
By definition, entropy is the measure of the total disorder in a system. A decision tree uses a top-down approach to build a model by continuously splitting the data into small portions. Before each split, It calculates the entropy to understand the information gain it would get from a split. Entropy is the main input to the information gain equation. The Decision tree model calculates the entropy for the parent node and the child node, and then it finds the information gain using these two measures. The formula for entropy is like the following-
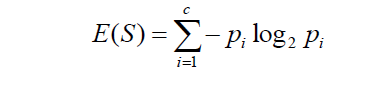
Here
- E represents the measure of entropy
- Pi is the probability of a class or feature in each split
This entropy is used in an information gain equation which is like the following-

Here
- IG represents the information gain
- E(Y) is the entropy measure of a parent node
- E(Y|X) is the measure of the child node
The goal of a decision tree model is to decrease entropy and increase the information gain.
Which Node has Maximum Entropy in a Decision Tree?
It depends on the majority of features. When a node has all homogenous data i.e. all the data points are similar, the entropy will be the lowest. But when the node contains data points equally from each feature, in other words, there is no majority of a particular feature, then the node will experience the maximum entropy.
How to Find the Best Split in a Decision Tree?
The split is done by calculating the total value of information gain. Higher information gain is dependent on the lower entropy of a node. So, to find the best split, we need to decrease the entropy of a node. This will help to increase the information gain, resulting in the best split for the decision tree.
What is the Difference Between a Classification Tree and a Regression Tree?
Both classification and regression use the same decision tree structure. Hence, there are not many differences between regression and a classification tree. Some of the key differences are-
- Regression tree uses continuous features whereas classification tree works with categorical features
- While splitting, a regression tree takes the mean of values from a group of data points. But classification tree takes the mode from a group of data points.
- A regression tree predicts the mean value of a class where a classification tree predicts the class which has the highest mode in a group
Final Words
In this tutorial, I tried to explain all the aspects of the decision tree for regression. The key take ways from the tutorial are
- What a decision tree is and how it works for regression
- Implementing decision tree for regression using python
- Advantages and disadvantages of decision trees
- Some important questions about decision trees
Hope this tutorial has helped you to understand all the concepts clearly. If you have any questions about the tutorial, let me know in the comments.
Happy Machine Learning!