- An Introduction to Machine Learning | The Complete Guide
- Data Preprocessing for Machine Learning | Apply All the Steps in Python
- Regression
- Learn Simple Linear Regression in the Hard Way(with Python Code)
- Multiple Linear Regression in Python (The Ultimate Guide)
- Polynomial Regression in Two Minutes (with Python Code)
- Support Vector Regression Made Easy(with Python Code)
- Decision Tree Regression Made Easy (with Python Code)
- Random Forest Regression in 4 Steps(with Python Code)
- 4 Best Metrics for Evaluating Regression Model Performance
- Classification
- A Beginners Guide to Logistic Regression(with Example Python Code)
- K-Nearest Neighbor in 4 Steps(Code with Python & R)
- Support Vector Machine(SVM) Made Easy with Python
- Kernel SVM for Dummies(with Python Code)
- Naive Bayes Classification Just in 3 Steps(with Python Code)
- Decision Tree Classification for Dummies(with Python Code)
- Random forest Classification
- Evaluating Classification Model performance
- A Simple Explanation of K-means Clustering in Python
- Hierarchical Clustering
- Association Rule Learning | Apriori
- Eclat Intuition
- Reinforcement Learning in Machine Learning
- Upper Confidence Bound (UCB) Algorithm: Solving the Multi-Armed Bandit Problem
- Thompson Sampling Intuition
- Artificial Neural Networks
- Natural Language Processing
- Deep Learning
- Principal Component Analysis
- Linear Discriminant Analysis (LDA)
- Kernel PCA
- Model Selection & Boosting
- K-fold Cross Validation in Python | Master this State of the Art Model Evaluation Technique
- XGBoost
- Convolution Neural Network
- Dimensionality Reduction
Hierarchical Clustering | Machine Learning
Clustering: Clustering is an unsupervised learning algorithm. A cluster refers to groups of aggregated data points because of certain similarities among them. Clustering algorithms group the data points without referring to known or labeled outcomes.
There are commonly two types of clustering algorithms, namely K-means Clustering and Hierarchical Clustering. In this tutorial, we are going to understand and implement Hierarchical Clustering.
Hierarchical Clustering:
This is an unsupervised clustering algorithm that makes clusters of data points in a top-to-bottom or a bottom-up approach. The working principle of Hierarchical clustering can be intuitively understood by a tree-like hierarchy i.e. how different files are organized in sub-folders where the sub-folders are organized in folders. There are two basic distinctions of this algorithm based on their approach.
Agglomerative Hierarchical Clustering- follows a bottom-up approach
Divisible Hierarchical Clustering- follows a top to bottom approach
In this tutorial, we will focus on Agglomerative Hierarchical Clustering.
Agglomerative Hierarchical Clustering:
In this technique, Initially, each data point is taken as an individual cluster. Then the similar clusters are merged together at each iteration based on their proximity with each other. The algorithms run until one cluster or a defined number of clusters are found.
How Does The Algorithm work?
The working steps of the algorithm are as follows
Step 1: Make each data point a single-point cluster. That forms N clusters.
Step 2: Take the two closest data points and make them one cluster. That forms N-1 clusters.
Step 3: Take the two closest clusters and make them one cluster. That forms N-2 clusters
Step 4: Repeat Step 3 until there is only one cluster.
Let's apply these steps one by one clustering data points
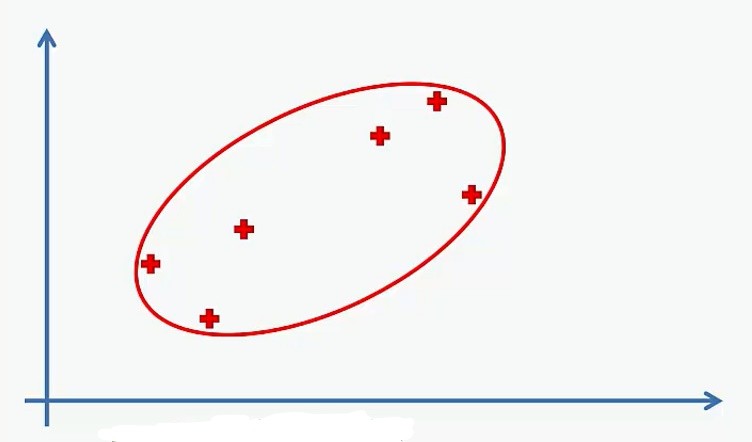
We take six data points here.
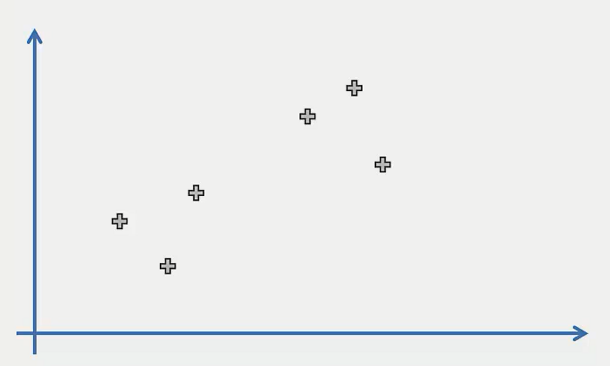
Step 1: Make each data point an individual cluster. That makes six clusters here
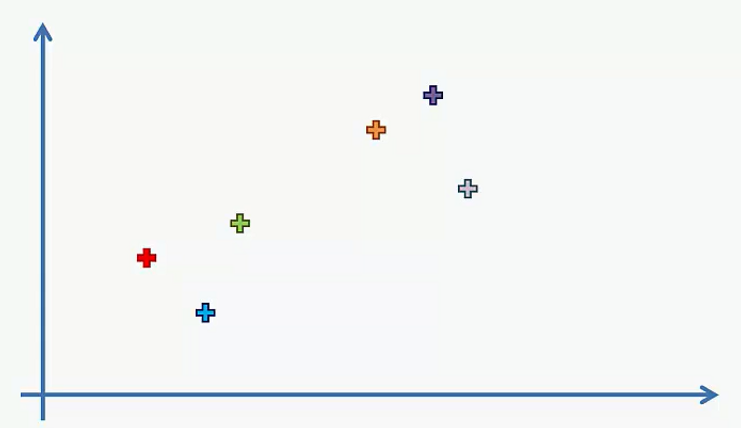
Step 2: Make two closest data points and make them one cluster. That forms 5 clusters.
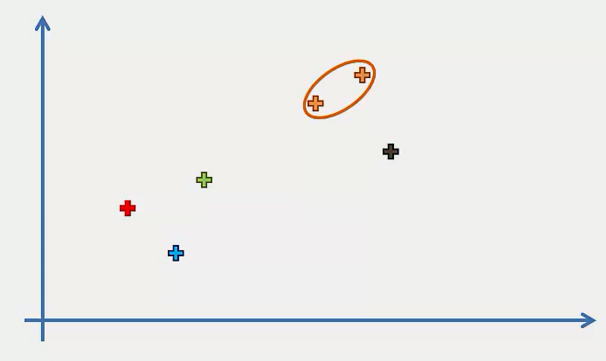
Step 3: Take the two closest clusters and make them one cluster. That forms 4 clusters.
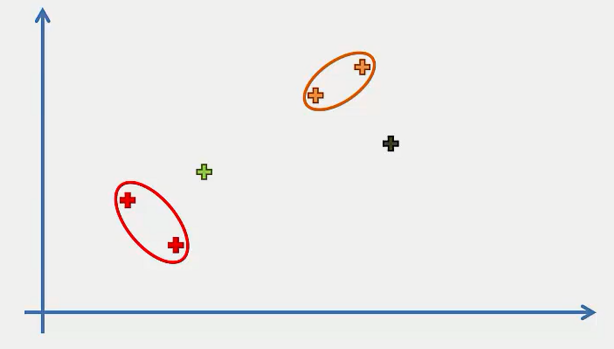
Step 4: Repeat step 3 until there is only one cluster.
In K-means clustering, we use the elbow method for selecting the number of clusters. For Hierarchical Clustering, we use a dendrogram to find the number of clusters.
Dendrogram: A Dendrogram is a tree-like diagram that records the sequences of merges or splits that occurred in the various steps of Hierarchical clustering. It's very helpful to intuitively understand the clustering process and find the number of clusters.
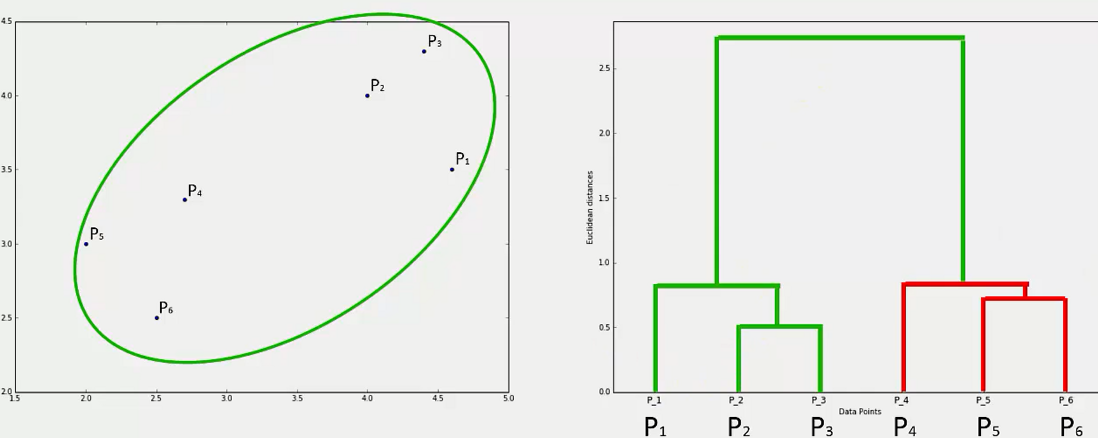
It keeps track of the merges of the clusters in a sequential order like above i.e. the P2 and P3 clusters are merged first, then P5 and P6 and so on. What does is that it calculates the dissimilarity or distance between the clusters and represents it with the vertical lines. The longer the distance the longer the verticals will be.
To find the number of clusters k, we set a threshold value on the vertical axis. Then we count those vertical lines which are the longest and do not intersect with other vertical lines. This count is taken as the number of clusters.
_LI.jpg)
HC in Python: Now, we will implement this algorithm in Python. First, we will set the working directory. Here we are using the Mall_Customers.csv dataset. Let's have a glimpse of that dataset.
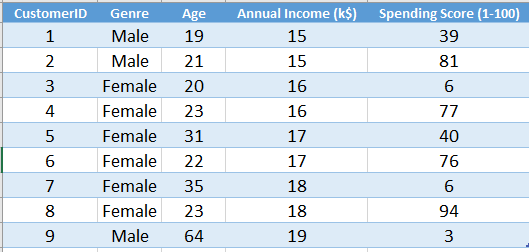
The dataset contains the data of some customers in a mall. Here we do not have any certain outcome or labeled output. So, we will implement Hierarchical Clustering to find some useful classes from this dataset.
You can download the whole dataset from here.
First of all, we will import essential libraries. You will get the code in Google Colab also.
import numpy as np import matplotlib.pyplot as plt import pandas as pd
Now, we will import the dataset. From the dataset, we will take the Annual Income and Spending Score in the feature matrix.
dataset = pd.read_csv('Mall_Customers.csv') X = dataset.iloc[:, [3, 4]].valuesWe need to find the number of clusters. For this, we will generate a dendrogram.
# Using the dendrogram to find the optimal number of clusters import scipy.cluster.hierarchy as sch dendrogram = sch.dendrogram(sch.linkage(X, method = 'ward')) plt.title('Dendrogram') plt.xlabel('Customers') plt.ylabel('Euclidean distances') plt.show() 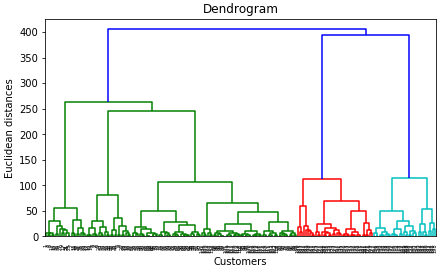
We set the threshold at 200(euclidian distance) and get 5 vertical lines that do not intersect with other lines. So the number of clusters will be 5.
Now, we will fit the Agglomerative HC into our dataset.
# Fitting Hierarchical Clustering to the dataset from sklearn.cluster import AgglomerativeClustering hc = AgglomerativeClustering(n_clusters = 5, affinity = 'euclidean', linkage = 'ward') y_hc = hc.fit_predict(X)
We have come to the final part. Let's visualize what our model has done!
# Visualising the clusters plt.scatter(X[y_hc == 0, 0], X[y_hc == 0, 1], s = 100, c = 'red', label = 'Cluster 1') plt.scatter(X[y_hc == 1, 0], X[y_hc == 1, 1], s = 100, c = 'blue', label = 'Cluster 2') plt.scatter(X[y_hc == 2, 0], X[y_hc == 2, 1], s = 100, c = 'green', label = 'Cluster 3') plt.scatter(X[y_hc == 3, 0], X[y_hc == 3, 1], s = 100, c = 'cyan', label = 'Cluster 4') plt.scatter(X[y_hc == 4, 0], X[y_hc == 4, 1], s = 100, c = 'magenta', label = 'Cluster 5') plt.title('Clusters of customers') plt.xlabel('Annual Income (k$)') plt.ylabel('Spending Score (1-100)') plt.legend() plt.show() 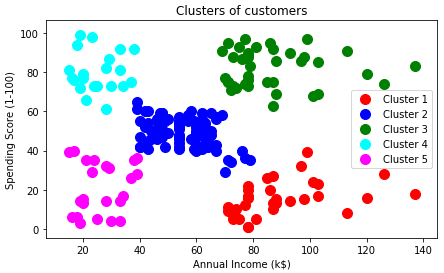
Hierarchical clustering performs well in a small set of data. For a large dataset, this algorithm does not fit well. You should use K-means clustering instead.